Source: sdtimes.com
In today’s modern software world, applications and infrastructure are melding together in different ways. Nowhere is that more apparent than with microservices, delivered in containers that also hold infrastructure configuration code.
That, combined with more complex application architectures (APIs, multiple data sources, multicloud distributions and more), and the ephemeral nature of software as temporary and constantly changing, is also changing the world of monitoring and creating a need for observability solutions.
First-generation application monitoring solutions struggle to provide the same level of visibility into today’s more virtual applications – i.e., containerized and/or orchestrated environments running Docker and Kubernetes. Massively distributed microservices-based applications create different visibility issues for legacy tools. Of course, application monitoring is still important, which has driven the need to add observability into the applications running in those environments.
While legacy application monitoring tools have deep visibility into Java and .NET code, new tools are emerging that are focused on modern application and infrastructure stacks. According to Chris Farrell, technical director and APM strategist at monitoring solution provider Instana, one of the important things about a microservice monitoring tool is that it has to recognize and support all the different microservices. “I think of it like a giant T where the vertical bar represents visibility depth and the horizontal bar represents visibility breadth,” he explained. “Legacy APM tools do great on the vertical line with deep visibility for code they support; meanwhile, microservices tools do well on the horizontal line, supporting a broad range of different technologies. Here’s the thing – being good on one axis doesn’t necessarily translate to value along the other because their data model is built a certain way. When I hear microservices APM, I think, ‘That’s what we do.’ [Instana has] both the depth of code-level visibility and the breadth of microservices support because that’s what we set out to do, solve the problem of ephemeral, dynamic, complex systems built around microservices.”
When talking about observability and application monitoring, it’s important to think about the different kinds of IT operations individuals and teams you have to deal with. According to Farrell “whether you’re talking about SREs, DevOps engineers or traditional IT operators, each has their own specific goals and data needs. Ultimately, it’s why a monitoring solution has to be flexible in what data it gathers and how it presents that data.
Even though it’s important for modern monitoring solutions to recognize and understand complexity, it’s not enough. They must also do so programmatically, Farrell said, because today’s systems are simply too complex for a person to understand. “You add in the ephemeral or dynamic aspect, and by the time a person could actually create a map or understand how things are related, something will change, and your knowledge will be obsolete,” he said.
Modern solutions also have to be able to spot problems and deliver data in context. Context is why it’s practically impossible for even a very good and knowledgeable operations team to understand exactly everything that’s going on inside their application themselves. This is where solutions that support both proprietary automatic visibility and manually injected instrumentation can be valuable. Even if you have the ability to instrument an application with an automated solution, there still is room for an observability piece to add some context. “Maybe it’s a parameter that was passed in; maybe it’s something to do with the specific code that the developer needs to understand the performance of their particular piece of code,” Farrell said of the need for contextual understanding.
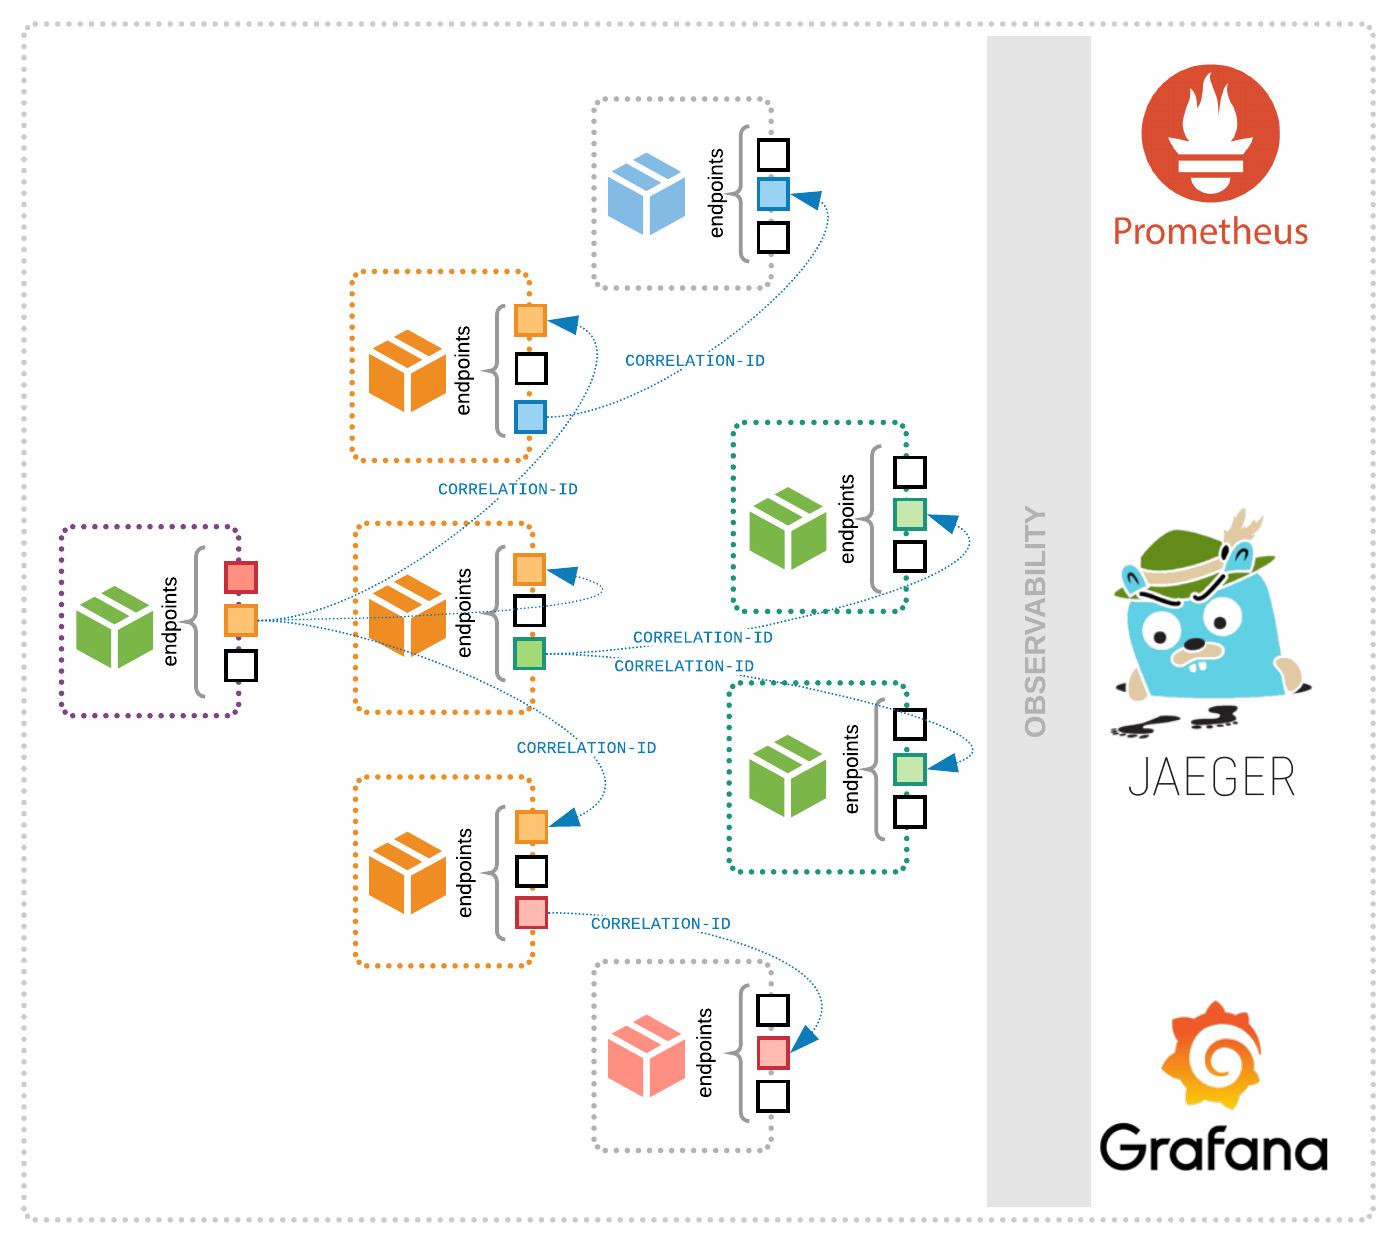
“That’s why a good modern monitoring tool will have its own metrics and have the ability to bring in metrics from observability solutions like OpenTracing, for example,” Farrell added. “Tracing is where a lot of this nice context comes out. Like Instana, it’s important to have the ability to do both. That way, you provide the best of both worlds.”
To make the ongoing decisions and take the right actions to deliver proper service performance, modern IT operations teams really require that deep context. It’s valuable for ongoing monitoring, deployment or rollback verification, troubleshooting and reporting. While observability on its own can provide information to an individual or a few individuals. It is the monitoring tool that provides understanding into how things work together; that can shift between a user-centric or an application-centric view, and that can give you a framework to move from monitoring to decision-making to troubleshooting and then, when necessary, moving into reporting or even log analysis.
Farrell pointed out that “the APM piece is the part that ties it all together to provide that full contextual visibility that starts with individual component visibility and ultimately ties it all together for application-level performance and service-level performance.”