Source: containerjournal.com
Kubernetes, in many ways, has allowed software organizations to realize the benefits of microservices by providing a convenient and powerful abstraction for deploying, scaling and running distributed software systems. Those benefits, however, have come at a cost for traditional software operations. Indeed, as microservices have grown in complexity and scale, teams have often struggled to adapt to the hidden costs that these powerful new technologies have uncovered—spiraling monitoring costs, misunderstanding or not understanding service dependencies, the creation of single human points of failure (aka the bus factor) and more.
If you haven’t yet encountered or experienced some of this pain, it’s very likely that it will impact you in some way in the future. But, this doesn’t have to be a cause for alarm or panic—the practice of observability can prevent these from happening.
What Is Observability?
Observability is a set of practices and processes that allow you to understand, and control, the internal state of the systems that you build and maintain. This control can be organizational or technical: using error budgets to prioritize certain development work or understanding the performance profile of your system under load. The concept of observability comes from the discipline of control theory, which seeks to quantify how you can observe and control a system using only its outputs. Observability isn’t simply a set of dashboards displaying time-series metrics or a searchable index of your application logs; it’s a holistic approach to understanding your entire system, and how it operates.
What it Really Costs to Monitor a System
Observability provides a solution to the ‘hidden costs’ mentioned earlier. First, observability provides a comprehensive approach to monitoring your distributed system. There’s two primary costs you can associate with traditional host-based monitoring systems:
- The capital costs required to collect and store reams of events and other telemetry data.
- The operational costs of engineering time to comprehend and investigate that data in the event of a service disruption, or when profiling the performance of a service or services in your application.
The capital cost can be quite high and shouldn’t be dismissed out of hand.
Consider the amount of storage, compute and network traffic required to aggregate and index log statements from a single service. Then multiply that by the count of instances of that service. Then multiply that by your desired retention period. Then multiply that by the amount of services involved in a single request through your application. That adds up to some serious money. The operational costs are potentially even higher, however—storage, compute and network bandwidth are cheap compared to hours or days of engineering time spent on unproductive “guess-and-check” correlation of spikes in time-series metric events with unstructured logs, especially when compared to the value of implementing and shipping new features.
Holistic Observability Addresses Hidden Costs
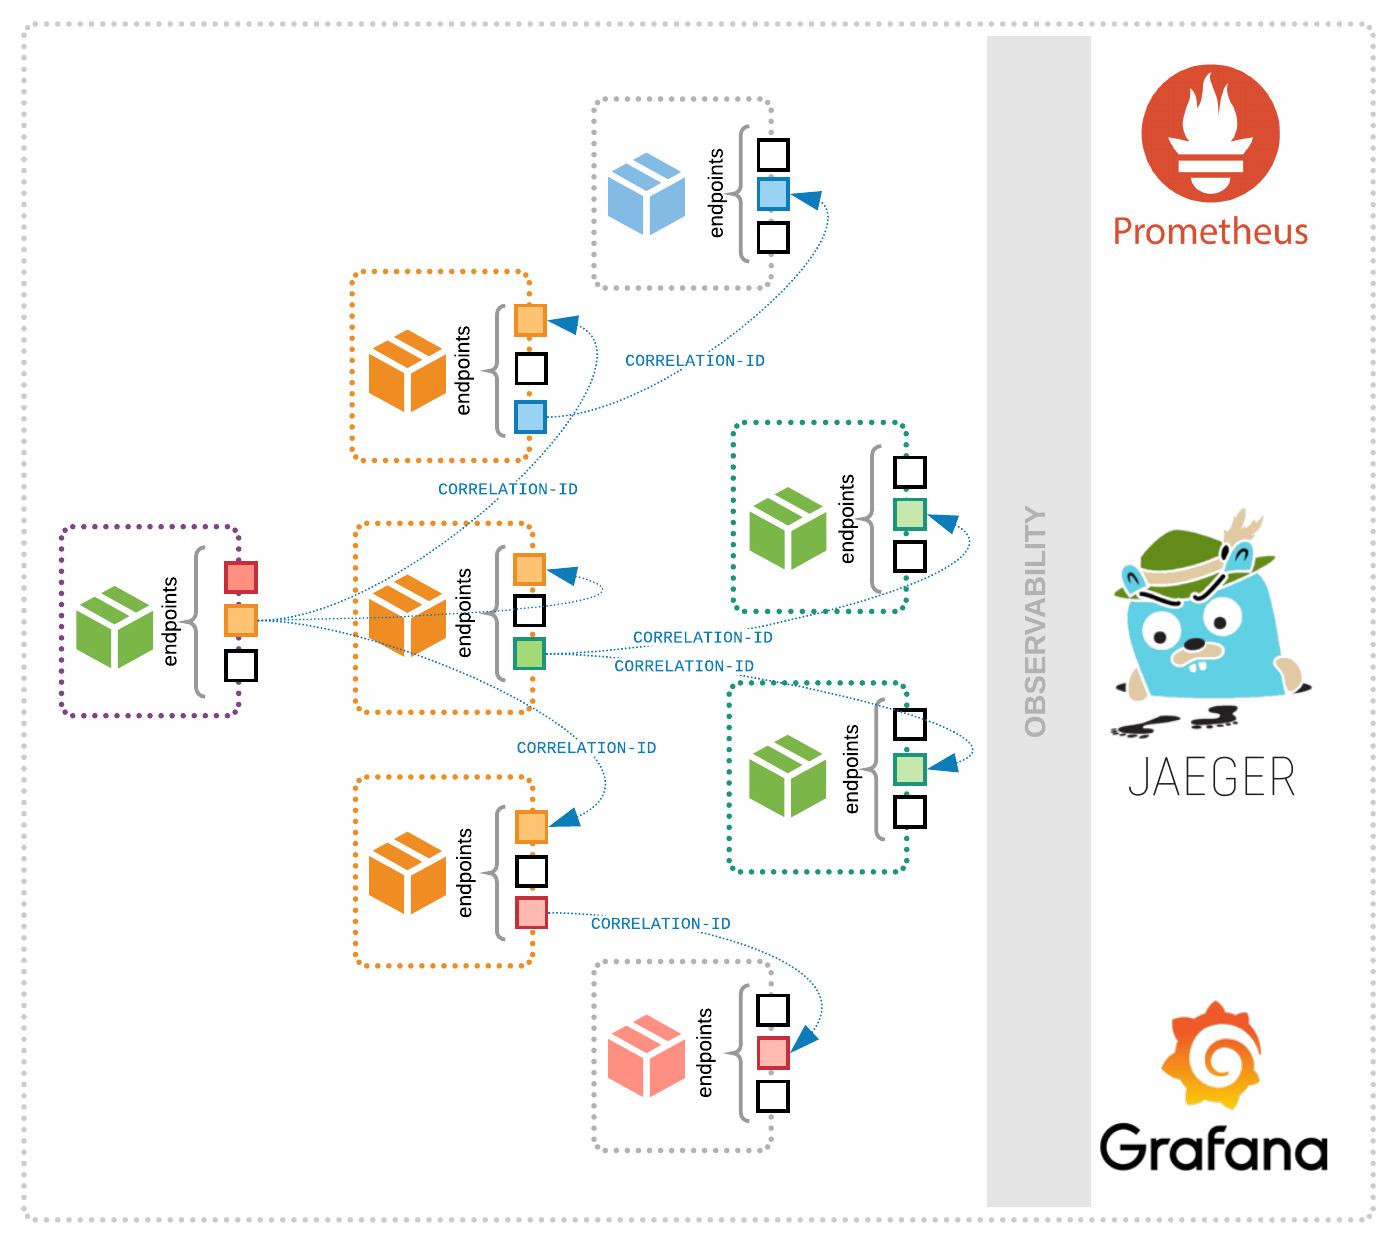
The practice of observability seeks to resolve these dilemmas by focusing on the production of high-quality, ubiquitous telemetry data in the form of metric, log and distributed trace events. An observability platform centers itself around these distributed tracing events, using them to reduce the search space for anomalies, outliers and other errors that are either contributing to an overall degradation of system performance or a general outage.
Holistic observability also addresses the issue of service dependency management and the siloing of information across teams. Traditional monitoring approaches often lead to circumstances in which any given team has a mismatch between what it can explicitly control and what it’s implicitly responsible for. This mismatch can breed frustration, burnout and a poor end user experience—your users aren’t aware of your architecture, after all, and aren’t likely to be more understanding of poor performance on the front end just because the root cause of that performance degradation was due to bugs in some lower-level service. The traditional response to ensuring high availability for microservices is to alert on everything, but this approach is so harmful to developers and operators that it has a name: alarm fatigue.
Observability seeks to combat both alarm fatigue and this responsibility-control mismatch by focusing on key indicators of the health of individual services—popularly known as service level indicators (or SLIs, and their friend the service level objective or SLO)—as well as providing telemetry data that can be used to generate contextual “service maps” of dependencies between individual services. The goal here is to focus on a few key indicators such as latency, error rate and throughput rather than on a scattershot of metrics with little contextual information about why they’re important.
Getting Started With Observability
How should you implement observability in your organization? The first and most critical component of observability is telemetry data. OpenTelemetry provides an open source, vendor-neutral telemetry API and SDK designed specifically to generate high-quality telemetry data. You’ll be able to use it to not only easily generate this data from existing services through automatic instrumentation but also to build custom metrics or traces from your application. Since it provides backward-compatibility with OpenTracing and OpenCencus, you can benefit from the extensive collection of integrations with existing frameworks and libraries that exist while looking forward to future integration into more parts of the cloud-native ecosystem, such as Kubernetes.
Second, you need to create an “observability platform” rather than a disjointed collection of dashboards and alarms. Distributed traces should be the heart of your platform. Their ability to impart context to requests as they flow through your application dramatically reduces the overhead required to identify performance regressions and makes it trivial to understand service dependencies. Use common SLIs such as latency, throughput and error rate across your entire system to provide clear apples-to-apples comparisons of performance across releases and provide clear context for teams as they communicate.
Finally, ensure that people are at the center of your observability strategy. Behind the numbers, think about what your goals are. Are they to ensure that people can enjoy their weekends, even when they’re on-call, because they know getting paged won’t derail the rest of their day? Are they to give you the confidence to release a critical fix on a Friday afternoon, because you know you’ll be able to rapidly identify any regressions and rollback if required? Are they to make sure that you can quickly and accurately target specific end users that are having issues using your software, so you can fix it and make them happy? Your goals should be all of these reasons, and uncountable reasons more, that you decide to adopt observability.