Source – risingstack.com
Monitoring gives us observability in our system and helps us to discover, understand, and address issues to minimize their impact on the business. It’s clear then, why you should aim for the best solutions out there; especially when you build a microservices architecture that has brought up new challenges in regards to observability.
The future of microservices monitoring depends on what kind of solutions become standardized in the industry and what new features will we see in the future that will make your applications much better. In this article I theorize what are these new monitoring features and what can we expect in 2018.
Microservices Monitoring and Instrumentation
To collect and analyze monitoring data, first, you need to extract metrics from your system – like the Memory usage of a particular application instance. The type of monitoring that provides details about the internal state of your application is called white-box monitoring, and the metrics extraction process is called instrumentation.
Current APM (Application Performance Monitoring) solutions on the market like NewRelic and Dynatrace rely heavily on different levels of instrumentations, this is why you have to install vendor specific agents to collect metrics into these products.
Agents can instrument your application at various places. They can extract low-level language specific metrics like Garbage Collector behavior or library specific things like RPC and database latencies as well.
Keep in mind that instrumentations can be very specific and usually need expertise and development time. As instrumentations are part of the running code, a bad instrumentation can introduce bugs into your system or generate an unreasonable performance overhead.
Instrumenting your system can also produce extra lines of code and bloat your application’s codebase.
The Agent World of APM Vendors
We discussed earlier that current APM solutions provide agents to instrument our application and collect metrics. Creating and maintaining these agents need a lot of effort from the APM vendors side as they have to support multiple versions of languages and libraries that their customers use.
They need to continuously run tests against these different versions and benchmark their performance overhead to ensure that they won’t introduce any bug into the instrumented application.
If you check out collector agents from multiple APM vendors, you will realize that they are very similar from an implementation point of view. These companies put a tremendous amount of work to create the best agent for their customers while they reimplement the same thing and maintain their agent separately.
Having vendor specific agents can also lead to a situation when developers start to use multiple monitoring solutions and agents together as they miss some features from their current APM solution. Multiple agents usually mean multiple instrumentations on the same code piece, which can lead to an unnecessary performance overhead, false metrics or even bugs.
I think that the trend of using vendor-specific agents will change in the future and APM providers will join their efforts to create an open standard for instrumenting code. The future could lead to an era where agents are vendor-neutral, and all values will come from different backend and UI features.
Containers and Microservices Change the Game
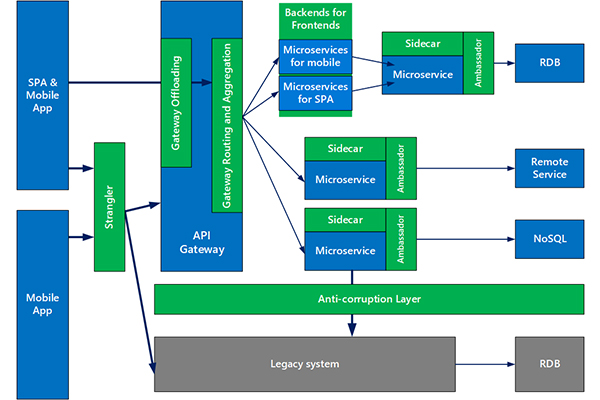
Latest technology and architecture trends like containerization and microservices changed the way we write and run our applications.
The new era of these highly dynamic distributed systems brought new challenges to the art of observability. To monitor and debug these architectures, we need a new set of tools that are capable of storing and querying a large amount of multidimensional metrics series from different services and are also able to discover issues in microservices.
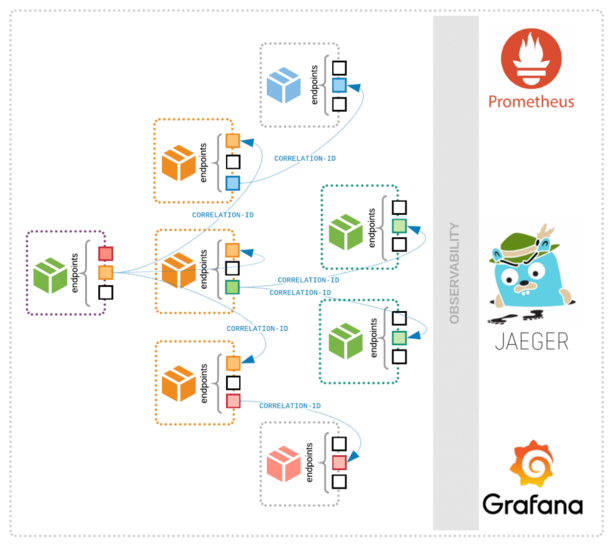
One of the new debugging methodologies is distributed tracing. It propagates transactions from distributed services and gains information from cross-process communication. To be able to track operations between applications, our instrumentation needs to share contextual information (like transaction ID’s) between processes in a standardized way. For example, when we create an RPC request to another service, it should share certain tracing information in meta headers to enable reverse engineering the transaction later.
With this kind of context sharing on the instrumentation level we can follow a request across the whole system; from the client through the underlying backend systems, network components, and databases. This kind of observability makes debugging in distributed systems, such as microservices, much easier. However, the popularity of microservices architectures is growing rapidly, distributed tracing is still in its early ages. Enterprise companies just started to evaluate the technology and discover its capabilities. We can expect an increasing amount of distributed tracing solutions in 2018 by early adopter companies.

New Instrumentation Standards: OpenTracing
In the previous sections, we discussed that an optimal instrumentation should have a vendor-neutral standardized interface with cross-process context sharing capabilities and only a minimal performance impact.
This is the challenge that OpenTracing wants to address with providing a standard, vendor-neutral interface for distributed tracing instrumentations. OpenTracing provides a standard API to instrument your code and connects it with different tracing backends. It also makes it possible to instrument your code once and change the Tracing backend without trouble anytime.
Check out the following code snippet to understand OpenTracing’s approach to standardized instrumentation:
const server = http.createServer((req, res) => {
  const requestSpan = tracer.startSpan('http_request', {
    childOf: tracer.extract(FORMAT_HTTP_HEADERS, req.headers)
  })
  const headers = {}

  metricsTracer.inject(requestSpan, FORMAT_HTTP_HEADERS, headers)

  requestSpan.setTag(Tags.HTTP_URL, req.url)
  requestSpan.setTag(Tags.HTTP_METHOD, req.method || 'GET')
  requestSpan.setTag(Tags.HTTP_STATUS_CODE, 200)
  requestSpan.setTag(Tags.SPAN_KIND_RPC_CLIENT, true)

  const childOperationSpan = tracer.startSpan('my_operation', {
    childOf: requestSpan
  })
  childOperationSpan.finish()

  res.writeHead(200, headers)
  res.end('Ok')
  requestSpan.finish()
})
Node.js OpenTracing Instrumentation
In certain languages, such as Node.js, it’s also possible to do the instrumentation automatically via the OpenTracing API. In this case, you only need to specify which backends you want to use to collect metrics. The helper library will instrument your code and call the standard Tracer API for the necessary events, for example when an HTTP request or database call happens.
The following code demonstrates how you can use multiple OpenTracing compatible Tracer backends with automatic instrumentation:
const Instrument = require('@risingstack/opentracing-auto')
const Tracer1 = require('tracer-1')
const Tracer1 = require('tracer-2')
const tracer1 = new Tracer1()
const tracer2 = new Tracer2()

const instrument = new Instrument({
  tracers: [tracer1, tracer2]
})
The future of standardized instrumentation also means that maintainers of open-source libraries and service providers can ship their solutions with built-in instrumentation. As they know the best how their libraries work and they have ownership of their internal behavior, this would be the optimal and the most risk-free solution.
I expect more and more standardized solutions for instrumentation in the future, and I hope one day all of the APM providers will work together to provide the best vendor-neutral agent. In this scenario, they will compete in who can provide the most insight and value on their backend and UI.
The One Microservices Instrumentation
OpenTracing is born to provide a vendor-neutral standard instrumentation for distributed tracing solutions, but it doesn’t mean that we cannot extract other kinds of information, like time-series metrics or error logs from it.
For example, by writing an OpenTracing compatible Tracer that calculates operation durations, we can measure request latency, throughput, and dependencies that can be consumed by monitoring solutions, like Prometheus. By collecting spans (events) with error flags to Elasticsearch or a similar storage, we can have an error tracker with only one instrumentation and multiple Tracer backends. In this way, we don’t have to double instrument our code per use-cases and deal with the performance overhead.
As OpenTracing also provides context about cross-process communications, we can use it to measure distributed operations in our system. For example, we can detect the throughput between two services, and we can also differentiate the metrics of traffic that comes from various sources.
Check out the following request throughout the metrics exported by OpenTracing to Prometheus. It contains the initiator parent_service label which we could determinate by the cross-process context sharing. The unknown value means that the source is not instrumented (in our case it’s the Prometheus scraper job that calls our service GET /metrics endpoint every 5 seconds):
Element
Value
{parent_service="my-server-1",service="my-server-3"}
10296
{parent_service="my-server-1",service="my-server-2"}
11166
{parent_service="unknown",service="my-server-1"}
10937
{parent_service="unknown",service="my-server-2"}
12
{parent_service="unknown",service="my-server-3"}

With the special OpenTracing Metrics Tracer we extract the data about the initiator of a specific RPC call. Then, we can reverse engineer the whole infrastructure topology based on this information and visualize the dependencies between services. From these metrics, we can also gain information about throughput and latencies between applications and databases in our microservices architecture.