Introduction to Data Visualization Tools
Data visualization tools have become increasingly popular as data analysis and interpretation have become more critical to businesses and organizations. These tools provide a visual representation of data sets, making it easier for users to understand complex information quickly. In this article, we will explore what data visualization tools are, why they are essential, the types of tools available, and the benefits of using them.
What are Data Visualization Tools?
Data visualization tools are software programs that help users represent data sets graphically. They use data from various sources to create visually appealing charts, infographics, dashboards, and maps that make it easier to identify trends, patterns, and relationships. While some data visualization tools require technical skills, others are user-friendly and require little to no coding knowledge.
Why Data Visualization Tools are Important?
Data visualization tools are essential because they provide an easy way to analyze, interpret, and communicate complex data. They allow businesses and organizations to make better-informed decisions, spot trends, and understand customer behavior. By turning data into visual representations, these tools help users to identify insights and correlations that may be challenging to spot with traditional data analysis methods.
Types of Data Visualization Tools
Charts and Graphs
Charts and graphs are the most common types of data visualization tools. They represent information in a visually appealing way and allow users to compare data sets quickly. Some examples of charts and graphs are line charts, bar charts, and pie charts.
Infographics
Infographics take data visualization to the next level by incorporating images and text. They provide a comprehensive overview of complex data sets in a visually appealing way.
Dashboards
Dashboards allow users to track multiple metrics in real-time. They provide a comprehensive overview of critical performance indicators and enable users to drill down into the data to uncover insights.
Maps
Maps are used to visualize data geographically. They allow users to identify patterns and trends based on the location.
Benefits of Using Data Visualization Tools
Understanding Complex Data
Data visualization tools provide an easy way to understand complex data sets. They make it easier to identify patterns and trends that would be challenging to identify with traditional data analysis methods.
Spotting Trends and Patterns
Data visualization tools allow users to spot trends and patterns in data quickly. This helps businesses and organizations make informed decisions based on data insights.
Better Decision Making
By providing a visual representation of data, data visualization tools help users make better-informed decisions. They provide a comprehensive overview of key performance indicators that allow users to identify areas that need improvement.
How to Choose the Right Data Visualization Tool
Consider Your Data and Audience
Consider the type of data you will be analyzing and the audience you are trying to reach. Some data visualization tools are better suited for certain data sets and audiences.
Cost and Ease of Use
Consider the cost and ease of use of the data visualization tool. Some tools are more expensive than others, and some require technical skills.
Customization and Integration
Consider the level of customization and integration the data visualization tool provides. Some tools allow users to customize the visuals, while others may integrate with other software programs.
Top Data Visualization Tools for Businesses
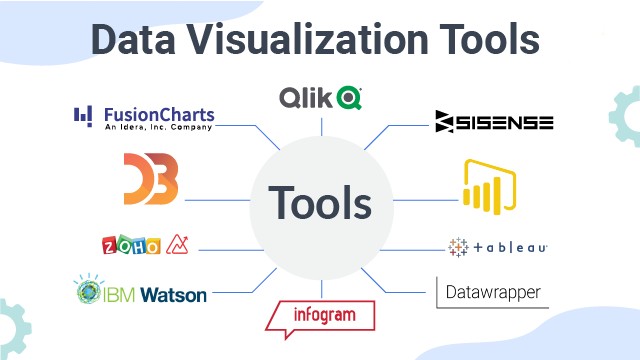
As businesses continue to generate more data, the need for effective data visualization tools becomes increasingly important. Here are some of the top data visualization tools that businesses are using today:
Tableau
Tableau is a popular tool for creating interactive and visually appealing dashboards that can quickly reveal insights from complex data. With its drag-and-drop interface and powerful analytics capabilities, Tableau has become a go-to tool for businesses in various industries.
Power BI
Microsoft’s Power BI is another popular data visualization tool that is commonly used by businesses. With its ability to connect to a wide range of data sources and its intuitive interface, Power BI allows users to quickly create impactful visualizations and dashboards.
Domo
Domo is a cloud-based business intelligence platform that offers a range of data visualization tools. Its platform provides both real-time and historical data insights, as well as the ability to create custom dashboards and alerts.
QlikView
QlikView is a data discovery and visualization tool that allows businesses to explore their data in a highly interactive way. Its intuitive interface and powerful data modeling tools make it a favorite among data analysts and business users alike.
Best Practices for Effective Data Visualization
Creating effective data visualizations requires more than just choosing the right tool. Here are some best practices to follow to ensure that your visualizations are impactful and meaningful:
Keep it Simple
Less is often more when it comes to data visualization. Avoid cluttering your charts and graphs with unnecessary information and stick to the key insights that you want to convey.
Choose the Right Type of Visualization
Different types of data require different types of visualizations. Bar charts, pie charts, and line graphs are all common types of visualizations, but it’s important to choose the right one based on the data you’re trying to represent.
Use Appropriate Colors and Fonts
The colors and fonts you choose can have a big impact on the readability and effectiveness of your visualizations. Make sure to choose colors that are visually appealing and easy to distinguish, and use fonts that are easy to read.
Future of Data Visualization Tools
As technology continues to advance, so do data visualization tools. Here are some trends to keep an eye on in the future of data visualization:
Artificial Intelligence
Artificial intelligence is being used to help businesses analyze and visualize their data in new and innovative ways. AI-powered data visualization tools can quickly identify patterns and trends that might otherwise go unnoticed.
Virtual and Augmented Reality
Virtual and augmented reality are also being explored as new ways to visualize data. These immersive technologies allow users to interact with data in a more dynamic and engaging way.
Interactive and Real-Time Visualizations
Real-time data visualization is becoming increasingly important as businesses strive to make faster decisions based on up-to-the-minute information. Interactive visualizations that allow users to drill down into specific data points are also gaining popularity as businesses seek to gain deeper insights from their data.In conclusion, data visualization tools are an essential part of any business or organization looking to make sense of large amounts of complex data. By using the right tool, you can quickly turn data into insights that can drive better decision-making and help you stay ahead of the competition. Whether you are just starting out or are an experienced data analyst, there is a data visualization tool out there that can help you achieve your goals. So take the time to explore the different options available and find the tool that works best for you.
FAQ
What are the benefits of using data visualization tools?
Data visualization tools offer several benefits, including the ability to understand complex data, spot trends and patterns, and make better decisions based on data-driven insights.
What types of data visualization tools are available?
There are several types of data visualization tools available, including charts and graphs, infographics, dashboards, and maps. Each type of tool has its own strengths and weaknesses and may be better suited for specific types of data.
How do I choose the right data visualization tool?
To choose the right data visualization tool, you should consider your data and audience, as well as factors such as cost, ease of use, customization, and integration with other tools and systems.
What are some best practices for effective data visualization?
Best practices for effective data visualization include keeping it simple, choosing the right type of visualization for your data, and using appropriate colors and fonts. It’s also important to test and iterate on your visualizations to ensure they are effectively communicating the desired insights.