What is pandas?
Pandas is a Python library used for data manipulation and analysis. It is one of the most popular Python libraries for data science. It provides high-performance, easy-to-use data structures, such as DataFrame and Series, which are optimized for speed and efficiency. With pandas, you can load, transform, and analyze large datasets with just a few lines of code.

What are the top use cases of pandas?
Top Use Cases of pandas:
- Data Cleaning and Transformation: Pandas provides intuitive and flexible functions to clean and transform messy data, such as handling missing values, removing duplicates, and converting data types.
- Data Exploration and Analysis: With pandas, you can easily explore and analyze your data by performing various statistical operations, filtering data based on specific criteria, and aggregating data to derive meaningful insights.
- Data Visualization: Pandas integrates well with other data visualization libraries, such as Matplotlib and Seaborn, allowing you to create informative plots and charts to visualize your data.
What are the features of pandas?
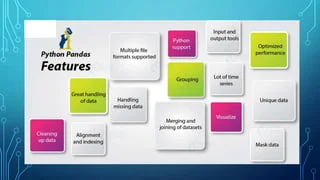
Features of pandas:-
- Data Structures: Pandas provides two primary data structures, namely Series and DataFrame, which are capable of handling structured and unstructured data efficiently.
- Data Reading and Writing: It supports reading and writing data from/to various file formats such as CSV, Excel, SQL databases, and more.
- Data Indexing and Selection: Pandas provides robust methods for indexing, slicing, and selecting data, including label-based (loc) and position-based (iloc) indexing.
- Data Cleaning and Manipulation: It offers functions for handling missing data, removing duplicates, transforming data, and performing aggregations.
- Data Alignment: Pandas automatically aligns data based on labels, allowing easy operations and computations on multiple datasets.
- Data Visualization: It integrates well with other visualization libraries like Matplotlib and Seaborn for creating interactive charts, plots, and graphs.
- Time Series Analysis: Pandas has extensive support for time-based data analysis, along with functionalities like resampling, time shifting, and frequency conversion.
- Data Merging and Joining: It provides powerful tools for combining and merging datasets based on common columns or indices.
- Grouping and Aggregation: Pandas facilitates grouping data based on specified criteria and performing aggregations like sum, mean, count, etc., on groups.
- Data I/O Performance: It is designed to handle big data efficiently and offers various tools to optimize performance, including parallel processing and memory optimization techniques.
What is the workflow of pandas?
The workflow of pandas can be divided into the following steps:
- Load the data. The first thing to do is put the information into a Pandas Data Frame. This can be done from a variety of sources, such as a CSV file, a database, or a spreadsheet.
- Explore the data. Once the data is loaded, you should explore it to get a better understanding of its content. This includes checking for missing values, outliers, and inconsistencies.
- Clean the data. Once you have a good understanding of the data, you can start cleaning it. This may involve removing missing values, correcting errors, and transforming the data into a format that is more suitable for analysis.
- Analyze the data. Once you’ve tidied up the data, you can begin studying and looking at it closely. This may involve using statistical methods to calculate summary statistics, create visualizations, or identify patterns.
- Model the data. If you are interested in making predictions, you can build a statistical model on the data. You can do this using different types of machine learning methods.
- Deploy the model. Once you have built a model, you can deploy it to production so that it can be used to make predictions on new data.
How Pandas Works & Architecture?
Pandas works by first converting the data into a Series or DataFrame data structure. These data structures are then used to perform data manipulation and analysis operations. Pandas also provides a number of built-in functions for data visualization.
The architecture of pandas is as follows:
- The core of pandas is the NumPy library, which provides support for multi-dimensional arrays.
- The pandas data structures are built on top of NumPy arrays.
- The pandas functions and methods are used to manipulate and analyze data in Series and DataFrame data structures.
How to Install and Configure Pandas?
To install and configure Pandas, follow these steps:
1. Open a command prompt or terminal.
2. Ensure you have Python and pip installed on your system. You can check their versions by running the following commands:
   python --version
   pip --version
If Python or pip is not installed, download and install them from the official Python website (python.org).
3. Install the Pandas package by running the following command:
pip install pandas
4. Once the installation is complete, you can import Pandas in your Python script or interactive shell by adding the following line at the beginning:
import pandas as pd
5. To verify that Pandas is installed correctly, you can type the following command:
python -c "import pandas as pd; print(pd.__version__)"
6. (Optional) If you need additional functionality, you may also need to install other packages that depend on Pandas. Most commonly used packages include NumPy and Matplotlib. You can install them using `pip`:
pip install numpy matplotlib
With these steps, you have successfully installed and configured Pandas in your system. You can now use it for data manipulation and analysis.
Step by Step Tutorials for pandas for the hello world program
Here is a step-by-step tutorial for the pandas hello world program:
- Import the pandas library:
import pandas as pd
- Create a DataFrame:
df = pd.DataFrame({'name': ['John Doe', 'Jane Doe'], 'age': [30, 25]})
- Print the DataFrame:
print(df)
This will print the following output:
       name  age
0  John Doe   30
1  Jane Doe   25
This is a simple example of how to use pandas to create and print a DataFrame. For more tutorials, you can refer to the pandas documentation: https://pandas.pydata.org/docs/.