Excel is a powerful spreadsheet program developed by Microsoft. It allows users to organize, analyze, and manipulate data using formulas and functions. With its user-friendly interface, Excel has become one of the most widely used software applications in the business world.
Top Use Cases of Excel
The top use cases of Excel are:
1. Data Analysis and Reporting: Excel allows users to quickly analyze and visualize data using various functions, formulas, and charts.
2. Budgeting and Financial Analysis: Many individuals and businesses use Excel for budgeting, forecasting, and financial planning.
3. Project Management: Excel can be used as a project management tool to track tasks, timelines, and resources.
4. Inventory Management: Excel is frequently used to manage inventory levels, track stock, and calculate reorder points.
5. Data Entry and Record Keeping: It can serve as a simple database to store and manage large amounts of data.
Features of Excel
Excel has a wide range of features, including:
- Spreadsheets: Excel spreadsheets are made up of rows and columns of cells. Each cell can contain text, numbers, formulas, or functions.
- Formulas: Formulas are used to calculate values in cells.
- Functions: Functions are built-in formulas that perform specific tasks.
- Charts and graphs: Excel can be used to create charts and graphs to visualize data.
- Macros: Macros are used to automate tasks.
- Data validation: Data validation is used to ensure that data entered into cells meets certain criteria.
- Pivot tables: Pivot tables are used to summarize data.
- Filters: Filters are used to display only certain rows or columns of data.
- Sort: Sort is used to arrange data in ascending or descending order.
Workflow of Excel
- Data Entry: Start by entering data into the spreadsheet. This can be done manually or by importing data from external sources.
- Data Manipulation: Use formulas and functions to manipulate and analyze the data. This includes calculations, sorting, filtering, and creating charts.
- Formatting: Apply formatting styles and conditional formatting to enhance the visual appearance of the spreadsheet and make it easier to read and interpret.
- Data Visualization: Create charts and graphs to visually represent the data and identify trends and patterns.
- Data Analysis: Use data analysis tools to perform in-depth analysis, such as regression analysis, goal seek, and solver.
- Reporting: Generate reports and summaries based on the analyzed data. This can include charts, tables, and written explanations.
How Excel Works & Architecture
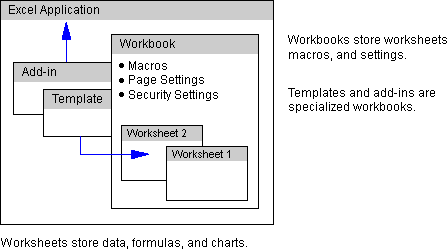
Excel is a complex program, but its basic architecture is relatively simple. It consists of three main components:
- The user interface: The user interface is responsible for providing a way for users to interact with the spreadsheet engine. The user interface is written in a programming language called C++. C++ is a powerful language that allows developers to create efficient and scalable software.
- The spreadsheet engine: The spreadsheet engine is the heart of Excel. It is responsible for storing data in cells, performing calculations, and formatting cells. The spreadsheet engine is written in a programming language called Visual Basic for Applications (VBA). VBA is a powerful language that allows you to customize Excel and automate tasks
- The add-ins: Add-ins are optional components that can be added to Excel to extend its functionality. Add-ins are written in a variety of programming languages, including VBA, C++, and Java.
Excel is a very efficient program. It uses a variety of techniques to optimize the performance of the spreadsheet engine, the user interface, and the add-ins. These techniques include caching, indexing, and parallel processing.
Caching is a technique that stores frequently used data in memory so that it does not have to be read from disk each time it is needed. Indexing is a technique that creates a lookup table for data so that it can be found quickly. Parallel processing is a technique that uses multiple processors to perform calculations simultaneously.
These techniques allow Excel to handle large amounts of data quickly and efficiently.
How to Install and Configure Excel
To install Excel, follow these steps:
- Purchase a Microsoft Office subscription or standalone Excel license.
- Visit the Microsoft Office website and sign in with your Microsoft account.
- Download the Office installation package and run the installer.
- Follow the on-screen instructions to complete the installation process.
Once Excel is installed, you can configure it according to your preferences. This includes setting default file locations, customizing the ribbon, and adjusting other settings.
Fundamental Tutorials of Excel Getting Started Step by Step
Here are some step-by-step tutorials for Excel:
- Opening Excel: To open Excel, click on the Excel icon on your desktop or search for “Excel” in the Start menu.
- Creating a New Workbook: When Excel opens, a new blank workbook is automatically created. You can start entering data or import data from external sources.
- Entering Data: To enter data, click on a cell and start typing. Press Enter to move to the next cell. You can also use the arrow keys to navigate between cells.
- Formatting Cells: To format cells, select the cells you want to format and choose the desired formatting options from the toolbar. This includes font styles, colors, borders, and number formatting.
- Creating Formulas: To create a formula, start with an equals sign (=) followed by the desired calculation. For example, “=A1+B1” adds the values in cells A1 and B1.
- Using Functions: Excel provides a wide range of functions for performing calculations. To use a function, start with the function name followed by the required arguments. For example, “=SUM(A1:A10)” calculates the sum of values in cells A1 to A10.
- Creating Charts: To create a chart, select the data you want to include in the chart and click on the “Insert” tab. Choose the desired chart type from the options available.
- Saving and Printing: To save your workbook, click on the “File” tab and choose “Save” or press Ctrl + S. To print your workbook, click on the “File” tab and choose “Print” or press Ctrl + P.
These fundamental tutorials provide a starting point for using Excel and understanding its basic features. With practice, you can explore more advanced features and capabilities of Excel.