Grafana and Prometheus are both open-source tools. It helps us in tackling issues related to complex data in a simplified manner.
What is Grafana?
Grafana is a general-purpose dashboard and graph composer. It focuses primarily on providing a rich way of visualizing time series metrics though graphs but supports other ways of visualizing data through pluggable panel architectures. It currently has rich support for Graphite, InfluxDB, and OpenTSDB. But supports other data sources through plugins.
What is Prometheus?
Prometheus is a system and service monitoring system. It collects metrics from configured goals at given intervals, evaluates rule expressions, displays results, and can trigger alerts if certain conditions are true.
Some of the features offered by Grafana:
- Create, edit, save & search dashboards
- Change column spans and row heights
- Drag and drop panels to rearrange
On the other hand, Prometheus provides the following key features:
- a multi-dimensional data model
- a flexible query language to leverage this dimensionality
- no dependency on distributed storage
Both are resolved the issues related to data.
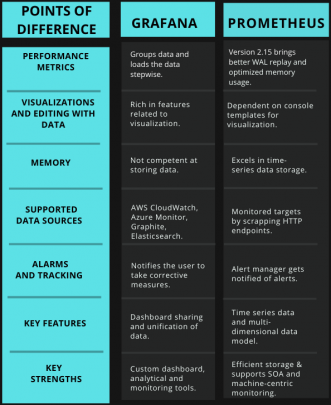
Here are some key comparisons:
Visualizations and Editing of Data
Grafana being an open-source data visualization tool is rich in features related to the visualization of time-series metrics. Plus, it provides additional options such as plugins to help its users visualize their data.
On the other hand, Prometheus has to rely on console templates for visualization. It can graph data but has to rely on Grafana for a complete framework like queries and dashboards.
Key Performance Metrics
Performance can be measured by the following parameters – Grafana
- Grouping: Only essential data is presented according to your screen resolution and panel size of the graph.
- Using stepwise Loading: In order to reduce slowdown when the graph is loading, the important graphs need to be prioritized, and other graphs need to be collapsed.
And Performance can be measured by following parameters – Prometheus
- Optimization of memory usage and data bytes and bits are commonly called blocks.
Improved WAL replay. - Compaction no longer stores symbols and postings in memory thereby boosting performance.
Memory Utilization
Grafana is only a visualization tool. It is not competent at handling data storage.
Prometheus takes the lead here. It excels at storing time-series data and organizing them with the required price tagging.
Supported Data Sources
Grafana supports the following data sources:
- AWS CloudWatch
- Azure Monitor
- Elasticsearch
- Google Stackdriver
- Graphite
- InfluxDB
In Prometheus, data metrics are collected from monitored targets by scraping HTTP endpoints.
Prometheus can do both data collection and visualization of the same.
Key Strengths
The key strengths of Grafana:
- Creating custom dashboards.
- Analytics and monitoring tool.
- Integration with tools like Prometheus, Graphite, InfluxDB, MySQL.
- Visualizing system CPU, memory, I/O utilization metrics.
The key strengths for Prometheus:
- Efficient storage.
- Supports machine-centric and service-oriented architecture monitoring.
- Availability of viewing statistics of a system.
Grafana and Prometheus: Which is Better?
Breaking down complex data in an understandable way would be the first choice for any organization.
Unlike Prometheus, Grafana offers maximum options to break down data into an understandable form. Its feature of supporting multiple databases, it helps in making better sense of the data.
Prometheus specializes in event monitoring and has very little to do with the visualization part. Even it has to rely on Grafana for better optimization of the data.
From the above discussion, it becomes quite clear that when it comes to doing full justice to the data then Grafana would be a better option.
Difference between Grafana vs Prometheus through Tabular form: