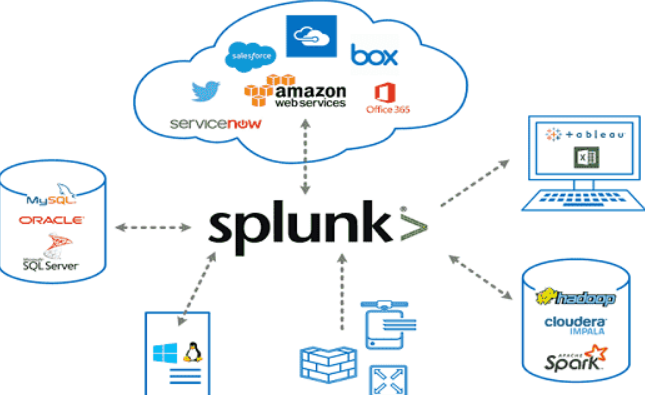
In the digital age, data is at the core of decision-making, system optimization, and innovation. As businesses and IT systems generate enormous amounts of machine data from applications, servers, devices, and networks, the need for a robust platform to monitor, analyze, and visualize this data has become critical. Splunk is a leading data analytics and monitoring platform that provides real-time insights into machine-generated data, enabling organizations to make informed decisions, troubleshoot issues, and enhance system reliability.
Splunk is widely recognized for its ability to process unstructured and semi-structured data, providing meaningful insights through powerful dashboards, search functionalities, and analytics. With its scalability and flexibility, Splunk serves various use cases across IT operations, security, business analytics, and more, making it an indispensable tool for enterprises worldwide.
What is Splunk?
Splunk is an enterprise-grade data platform that collects, indexes, and analyzes machine data in real time. It transforms raw, unstructured data into meaningful insights by enabling users to query, visualize, and act on their data. Splunk is known for its ability to handle diverse data sources, including logs, metrics, events, and network data, making it a comprehensive solution for monitoring and analytics.
Available in multiple editions such as Splunk Enterprise, Splunk Cloud, and Splunk Free, the platform caters to different organizational needs. Splunk’s modular ecosystem includes additional tools like Splunk Enterprise Security (ES), Splunk IT Service Intelligence (ITSI), and Splunk Phantom for security orchestration, making it a versatile choice for various industries.
Top 10 Use Cases of Splunk
- IT Operations Monitoring
Gain real-time visibility into IT infrastructure performance, detect bottlenecks, and optimize resource utilization. Splunk enables proactive monitoring of servers, networks, and applications. - Security Information and Event Management (SIEM)
Use Splunk to monitor and analyze security logs, detect anomalies, and respond to potential threats. With Splunk Enterprise Security (ES), organizations can strengthen their cybersecurity posture. - Log Management and Analysis
Centralize logs from multiple sources, correlate data, and troubleshoot issues faster. Splunk’s powerful search capabilities make it easy to find the root cause of problems. - Application Performance Monitoring (APM)
Track application health, monitor transaction times, and identify performance bottlenecks. Splunk ensures a seamless user experience by providing actionable insights into application behavior. - Cloud Resource Monitoring
Monitor cloud infrastructure across platforms like AWS, Azure, and Google Cloud. Splunk provides insights into resource utilization, cost efficiency, and security compliance in cloud environments. - Fraud Detection and Prevention
Analyze transaction patterns and user behavior to detect and prevent fraudulent activities. Splunk’s machine-learning capabilities make it ideal for anomaly detection. - DevOps Observability
Enhance DevOps workflows by monitoring CI/CD pipelines, containerized environments, and microservices. Splunk integrates seamlessly with Kubernetes, Docker, and Jenkins for full-stack observability. - IoT Data Analytics
Monitor and analyze data from IoT devices to improve operational efficiency and enable predictive maintenance. Splunk’s scalability makes it suitable for managing large IoT deployments. - Business Analytics
Derive actionable business insights from machine data, such as customer engagement metrics, sales trends, and operational performance. - Compliance and Audit Reporting
Ensure adherence to regulatory standards by collecting and analyzing audit logs. Splunk simplifies compliance reporting with pre-built dashboards and templates.
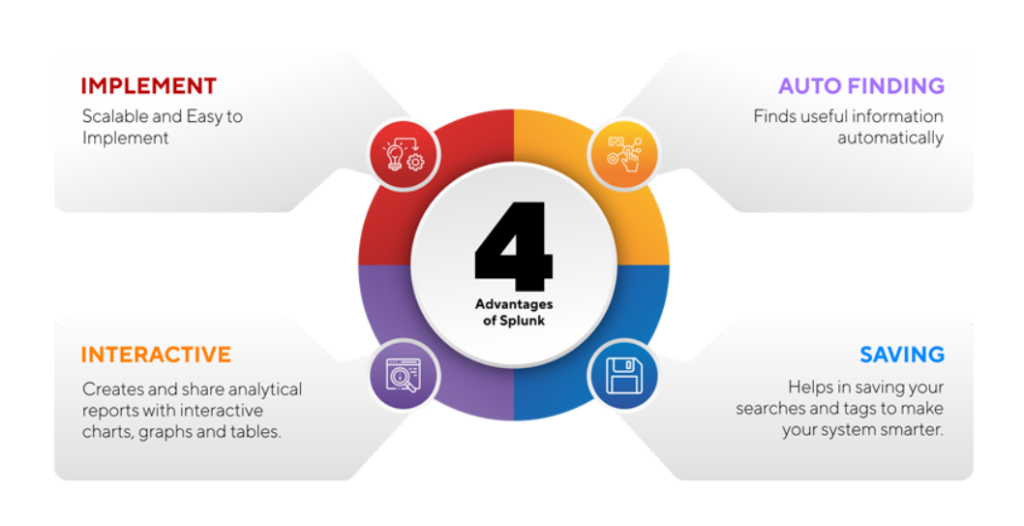
What Are the Features of Splunk?
- Data Collection and Indexing
Splunk collects data from a wide range of sources, including logs, metrics, events, APIs, and IoT devices. It indexes this data for efficient querying and analysis. - Powerful Search Processing Language (SPL)
Use SPL to query, filter, and analyze data with precision. SPL supports complex queries for advanced analytics. - Real-Time Monitoring and Alerting
Set up real-time dashboards and configure alerts for specific events or thresholds, ensuring quick responses to critical issues. - Advanced Visualization Tools
Create interactive charts, graphs, heatmaps, and dashboards to visualize trends and correlations in data. - Machine Learning and AI
Leverage built-in machine learning models for predictive analytics, anomaly detection, and root cause analysis. - Scalability and High Availability
Scale Splunk horizontally to handle massive amounts of data, ensuring high performance and availability. - Integration with Third-Party Tools
Integrate Splunk with popular tools like AWS, ServiceNow, Jira, Kubernetes, and more to extend its capabilities. - Role-Based Access Control (RBAC)
Implement RBAC to secure sensitive data and ensure users have appropriate access permissions. - App Ecosystem
Extend Splunk’s functionality with apps and add-ons from Splunkbase, including pre-built solutions for specific use cases. - Automation and Orchestration
Automate workflows and incident responses using Splunk Phantom for security and IT operations.
How Splunk Works and Architecture
How It Works:
Splunk collects raw data from multiple sources, processes and indexes it, and provides tools for searching, analyzing, and visualizing this data. Users interact with Splunk through a web interface to create queries, dashboards, and reports.
Architecture Overview:
- Data Sources:
Splunk collects data from servers, applications, devices, and APIs using forwarders, APIs, or direct connections. - Forwarders:
Installed on source systems, forwarders send raw data to the Splunk Indexer for processing. - Indexer:
The Indexer processes, indexes, and stores data for efficient querying and retrieval. - Search Head:
Acts as the user interface for querying and visualizing data. Users interact with the Search Head to create dashboards, reports, and alerts. - Knowledge Objects:
Include saved searches, reports, field extractions, and other metadata that enhance data usability. - Distributed Environment:
Splunk supports clustering for high availability, scalability, and fault tolerance.
How to Install Splunk
Steps to Install Splunk on Linux:
1. Download Splunk:
- Visit the Splunk website and download the appropriate package.
wget -O splunk.tgz https://download.splunk.com/products/splunk/releases/latest/linux/splunk-latest.tgz2. Extract the Package:
tar -xvf splunk.tgz -C /opt
cd /opt/splunk
3. Start Splunk:
- Run the following command to start Splunk for the first time:
./bin/splunk start- Accept the license agreement and create admin credentials.
4. Access Splunk Web Interface:
- Open your browser and navigate to
http://<your_server_ip>:8000. - Log in using the admin credentials.
5. Add Data Sources:
- Use the web interface to configure data inputs, such as file directories, APIs, or syslogs.
6. Verify Installation:
- Run a test query in the Search & Reporting app to confirm data ingestion.
Basic Tutorials of Splunk: Getting Started
1. Adding Data Sources:
- Navigate to “Settings” > “Add Data” and configure inputs for file directories, network ports, or APIs.
2. Running a Search Query:
- Use SPL to search indexed data:
index=_internal | stats count by sourcetype3. Creating Alerts:
- Define thresholds for alerts and configure notification channels like email or Slack.
4. Designing Dashboards:
- Build custom dashboards with graphs, tables, and visualizations to monitor key metrics.
5. Using Machine Learning:
- Apply machine learning models for predictive maintenance or anomaly detection.
6. Integrating with External Tools:
- Connect Splunk to ServiceNow, AWS, or Kubernetes using apps from Splunkbase.
Conclusion
Splunk is a versatile platform that empowers organizations to harness the power of their machine data. With its comprehensive features, scalability, and robust ecosystem, Splunk serves a wide range of use cases, from IT monitoring and security to business analytics and IoT. By providing real-time insights and enabling proactive management, Splunk helps organizations optimize operations, enhance security, and drive innovation.
Hashtags
#Splunk #DataAnalytics #ITMonitoring #LogManagement #SecurityAnalytics #MachineLearning #CloudMonitoring #DevOpsTools #IoTAnalytics #ApplicationPerformance
Let me know if you’d like additional refinements or specific additions!
