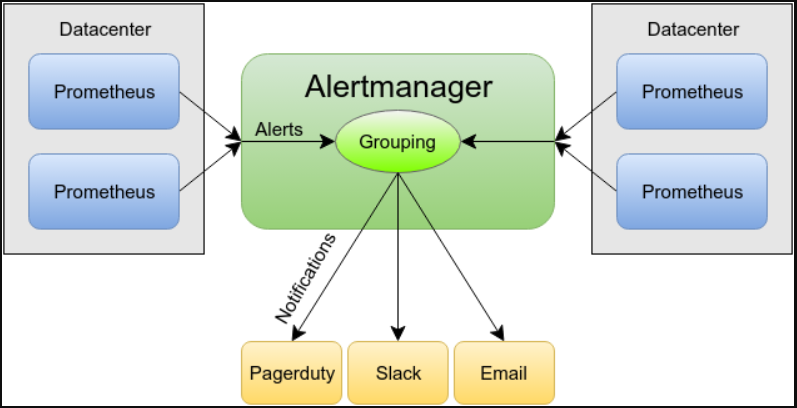
In today’s dynamic IT environments, monitoring and alerting are essential for ensuring system reliability and uptime. Alertmanager, a core component of the Prometheus monitoring ecosystem, is designed to manage alerts generated by Prometheus and other monitoring systems. It handles alert deduplication, routing, silencing, and notification delivery, making it a critical tool for IT and DevOps teams. In this blog, we’ll explore what Alertmanager is, its top use cases, features, architecture, and installation, and provide basic tutorials to help you get started.
What is Alertmanager?
Alertmanager is an open-source alert management tool developed as part of the Prometheus ecosystem. It processes alerts sent by monitoring systems, manages their lifecycle, and routes them to various notification channels such as email, Slack, PagerDuty, and more. Alertmanager helps ensure that alerts reach the right people at the right time, avoiding alert fatigue and ensuring efficient incident management.
Key highlights of Alertmanager:
- Deduplicates and groups related alerts.
- Supports advanced routing rules for delivering alerts to the right recipients.
- Offers silence and inhibition capabilities to prevent unnecessary alerts.
- Integrates seamlessly with Prometheus and other monitoring systems.
Top 10 Use Cases of Alertmanager
- Centralized Alert Management
Consolidates alerts from multiple Prometheus instances into a single system for streamlined management. - Alert Deduplication
Removes duplicate alerts to reduce noise and prevent redundant notifications. - Custom Notification Routing
Routes alerts to specific teams or individuals based on defined rules. - Incident Prioritization
Assigns severity levels to alerts, ensuring critical issues are addressed promptly. - Silencing Alerts During Maintenance
Temporarily suppresses alerts for systems undergoing scheduled maintenance. - Integration with Communication Channels
Sends alerts to email, Slack, PagerDuty, OpsGenie, and other channels. - Inhibition Rules
Suppresses alerts that are triggered by known or dependent issues. - Multi-Tenant Alert Management
Manages alerts for multiple teams or environments in a shared infrastructure. - Escalation Policies
Supports notification escalation based on alert persistence or severity. - Metric-Based Alerting
Combines with Prometheus to generate alerts based on metric thresholds or trends.
What Are the Features of Alertmanager?
- Alert Deduplication
Groups similar alerts to reduce noise and avoid redundant notifications. - Routing Rules
Directs alerts to appropriate recipients based on labels, severity, and other attributes. - Silencing
Temporarily suppresses alerts based on defined conditions. - Inhibition
Prevents certain alerts from being sent if related higher-priority alerts are already active. - Integration Support
Natively integrates with Prometheus, Grafana, and third-party notification platforms. - High Availability
Supports clustering for redundancy and reliability. - Flexible Configuration
Configures routing, silencing, and inhibition rules using YAML files. - Escalation Support
Implements escalation policies for persistent or unresolved alerts. - Multi-Channel Notifications
Sends alerts via email, Slack, PagerDuty, OpsGenie, webhook, and more. - Open-Source Community
Backed by a vibrant community offering extensive documentation and support.
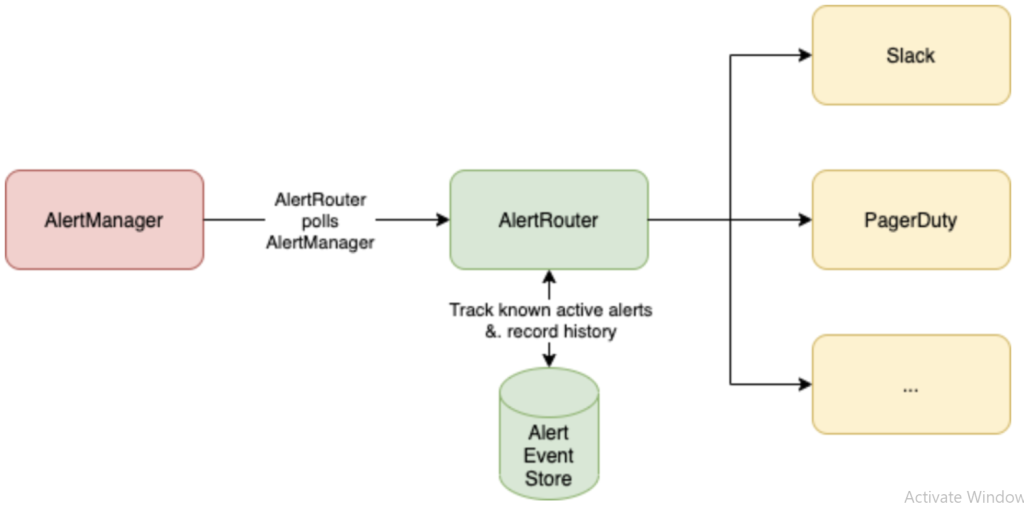
How Alertmanager Works and Architecture
How It Works
- Alert Generation
Alerts are generated by Prometheus or other monitoring tools based on metric thresholds or conditions. - Alert Processing
Alertmanager receives alerts, deduplicates similar ones, and processes them according to defined rules. - Routing
Alerts are routed to specified notification channels based on routing rules. - Notification Delivery
Delivers alerts via email, chat platforms, or incident management tools. - Silencing and Inhibition
Suppresses alerts based on conditions like maintenance or dependencies.
Architecture Overview
- Alert Sources:
Prometheus or other monitoring systems send alerts to Alertmanager via HTTP. - Routing Tree:
Configured rules determine how alerts are routed to different receivers. - Notification Channels:
Alertmanager delivers alerts to various channels like email, Slack, PagerDuty, etc. - Silencing and Inhibition Engine:
Prevents unnecessary alerts from being sent. - High Availability:
Alertmanager instances can be clustered for redundancy.
How to Install Alertmanager
1. System Requirements
- Supported OS: Linux, macOS, or Windows.
- Tools: Prometheus setup for alert generation.
2. Installation Steps
- Download Alertmanager: Download the latest release from the official Prometheus GitHub page:
wget https://github.com/prometheus/alertmanager/releases/download/v<version>/alertmanager-<version>.tar.gz- Extract Files:
tar -xvf alertmanager-<version>.tar.gz
cd alertmanager-<version>- Start Alertmanager:
./alertmanager --config.file=alertmanager.yml3. Configure Alertmanager
- Create a
alertmanager.ymlfile to define routing, receivers, and notification settings:
global:
  smtp_smarthost: 'smtp.example.com:587'
  smtp_from: 'alertmanager@example.com'
  smtp_auth_username: 'username'
  smtp_auth_password: 'password'

route:
  receiver: 'email-notifications'

receivers:
  - name: 'email-notifications'
    email_configs:
      - to: 'team@example.com'
4. Integrate with Prometheus
- Add Alertmanager configuration in
prometheus.yml:
alerting:
  alertmanagers:
    - static_configs:
- targets: ['localhost:9093']- Reload Prometheus to apply changes:
curl -X POST http://localhost:9090/-/reloadBasic Tutorials of Alertmanager: Getting Started
1. Define Alerts in Prometheus
Add alert rules in Prometheus rules.yml:
groups:
  - name: instance_down
    rules:
      - alert: InstanceDown
        expr: up == 0
        for: 5m
        labels:
          severity: critical
        annotations:
          summary: "Instance {{ $labels.instance }} down"
          description: "Instance {{ $labels.instance }} has been down for more than 5 minutes."
2. Run Alertmanager
Start Alertmanager and verify it’s running:
./alertmanager --config.file=alertmanager.yml3. Send a Test Alert
Trigger an alert and check if it routes to the specified notification channel.
4. Set Up Silence Rules
Use Alertmanager’s web UI to create silence rules during maintenance windows.
5. Explore Routing Rules
Create complex routing trees in alertmanager.yml to direct alerts to different teams based on severity.
6. Test Notifications
Validate notification delivery via email, Slack, or other integrated tools.
7. Cluster Alertmanager
Set up multiple Alertmanager instances for high availability.
