Managing and analyzing data efficiently is vital in today’s data-driven environment, where logs, metrics, and events from systems and applications are constantly generated. The Elastic Stack, formerly known as the ELK Stack, is a suite of open-source tools designed to help organizations collect, process, store, analyze, and visualize large volumes of data in real-time. It is built around four core components: Elasticsearch, Logstash, Kibana, and Beats, each serving a specific role in the data pipeline.
Elastic Stack provides an end-to-end solution for observability, search, and analytics. It is widely used for log management, infrastructure monitoring, application performance tracking, and security analytics. Its scalability and flexibility make it an indispensable tool for DevOps, IT operations, and data engineering teams, empowering them to gain actionable insights from their data.
What is Elastic Stack?
The Elastic Stack is an open-source platform that enables you to collect data from diverse sources, transform it into structured formats, and analyze it for actionable insights. It is comprised of the following tools:
- Elasticsearch: A distributed search and analytics engine designed for fast and scalable indexing, querying, and analysis.
- Logstash: A data pipeline that ingests, processes, and transforms raw data before sending it to Elasticsearch.
- Kibana: A visualization and analytics platform that provides dashboards, charts, and reports for analyzing data stored in Elasticsearch.
- Beats: Lightweight data shippers that send data from edge devices to Logstash or Elasticsearch.
Elastic Stack allows organizations to monitor their infrastructure, analyze logs, secure systems, and extract business intelligence from their data. Its ability to handle petabytes of data in real-time makes it a preferred choice for enterprises and startups alike.
Top 10 Use Cases of Elastic Stack
- Centralized Log Management
Elastic Stack excels at aggregating logs from multiple systems and applications into a central repository, making it easy to search, analyze, and troubleshoot issues. - Application Performance Monitoring (APM)
Monitor application performance metrics, such as response times, error rates, and transaction volumes, using Elastic APM integrated with Elastic Stack. - Security Analytics
Use Elastic Security to detect, investigate, and respond to security threats, such as unauthorized access and data breaches. - Infrastructure Monitoring
Gain visibility into your servers, networks, and containers by collecting metrics and events from your infrastructure. - Real-Time Anomaly Detection
Leverage machine learning capabilities to identify anomalies in system behavior, helping to predict and prevent potential issues. - Business Intelligence
Analyze business metrics, such as sales trends or customer interactions, by visualizing data in custom dashboards. - DevOps Observability
Track system performance and application health across CI/CD pipelines, Kubernetes clusters, and microservices architectures. - E-Commerce Search Optimization
Power search functionality for e-commerce platforms by indexing product catalogs in Elasticsearch and providing fast, relevant results. - IoT Data Analysis
Collect, process, and analyze data from IoT devices for insights into device health, usage patterns, and operational efficiency. - Compliance and Audit Logging
Store and analyze logs for regulatory compliance, ensuring that your systems adhere to industry standards and guidelines.
What Are the Features of Elastic Stack?
- High-Performance Search and Indexing
Elasticsearch provides lightning-fast search and indexing capabilities, even for massive datasets. - Real-Time Data Ingestion
Logstash and Beats enable the ingestion of data from various sources in real time, ensuring that insights are always up to date. - Customizable Dashboards
Kibana allows users to create interactive dashboards and visualizations tailored to their specific needs. - Scalable Architecture
Elastic Stack is built for scalability, allowing organizations to handle growing datasets by adding more nodes to the cluster. - Multi-Source Data Collection
Beats can collect data from logs, metrics, network packets, and other sources, providing a comprehensive view of system performance. - Machine Learning
Built-in machine learning features allow for anomaly detection, forecasting, and predictive analytics. - Security Features
Elastic Security offers role-based access control (RBAC), encryption, and intrusion detection to secure your data. - Integration Ecosystem
Seamlessly integrates with third-party tools like Grafana, Prometheus, and Kubernetes for extended observability. - Role-Based Access and Control
Define access permissions for different users and teams to secure sensitive data. - Rich Query Language
Elasticsearch supports complex queries, including full-text search, filtering, and aggregation, to retrieve meaningful insights from data.
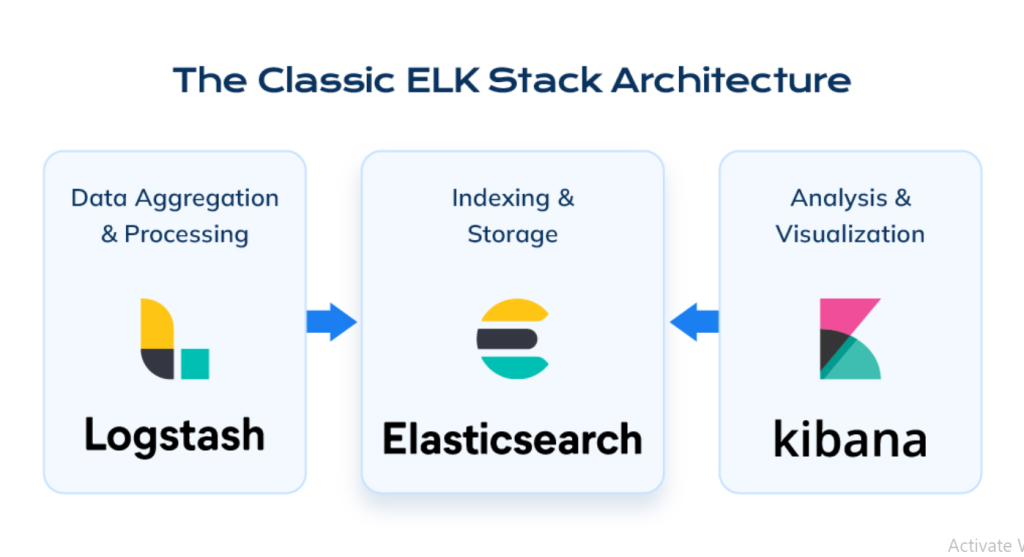
How Elastic Stack Works and Architecture
Elastic Stack follows a modular architecture where each component plays a distinct role in the data lifecycle:
- Beats (Data Collection):
Beats are lightweight agents that collect data from edge devices, such as logs, metrics, and network packets, and ship them to Logstash or Elasticsearch. - Logstash (Data Processing):
Logstash acts as a data pipeline, ingesting raw data, transforming it into structured formats, and forwarding it to Elasticsearch. - Elasticsearch (Data Storage and Search):
Elasticsearch indexes and stores the data, enabling efficient search, analysis, and querying. - Kibana (Visualization and Analysis):
Kibana provides a user-friendly interface for visualizing data through dashboards, charts, and graphs, as well as managing alerts and machine learning models. - Security and Observability Layers:
Elastic Security and observability features add an additional layer of monitoring and protection, ensuring data integrity and compliance.
How to Install Elastic Stack
Steps to Install Elastic Stack on Linux:
1.Install Elasticsearch:
- Download Elasticsearch from the official website.
- Install it using:
sudo apt update
sudo apt install elasticsearch- Start the Elasticsearch service:
sudo systemctl start elasticsearch
sudo systemctl enable elasticsearch2.Install Logstash:
- Download and install Logstash:
sudo apt install logstash- Configure Logstash by creating a pipeline configuration file (
/etc/logstash/conf.d/logstash.conf).
3. Install Kibana:
- Install Kibana for data visualization:
sudo apt install kibana- Start the Kibana service:
sudo systemctl start kibana
sudo systemctl enable kibana
4. Install Beats (Optional):
- Install Filebeat for log collection:
sudo apt install filebeat- Configure Filebeat to send data to Logstash or Elasticsearch.
5. Access Kibana Dashboard:
- Open your browser and navigate to
http://<your_server_ip>:5601to access the Kibana interface.
6. Test the Setup:
- Generate sample data and verify that it flows from Beats to Elasticsearch and is visualized in Kibana.
Basic Tutorials of Elastic Stack: Getting Started
1. Configuring Filebeat for Log Collection:
- Define the log paths in
filebeat.ymland test the configuration:
filebeat.inputs:
  - type: log
    enabled: true
    paths:
- /var/log/*.log- Start Filebeat:
2. Creating a Logstash Pipeline:
Define input, filter, and output in the pipeline configuration file:
input {
  beats {
    port => 5044
  }
}
filter {
  grok {
    match => { "message" => "%{COMMONAPACHELOG}" }
  }
}
output {
  elasticsearch {
    hosts => ["localhost:9200"]
  }
}
3. Exploring Data in Kibana:
- Create an index pattern to visualize data stored in Elasticsearch.
- Build custom dashboards to monitor logs, metrics, or application traces.
4. Enabling Machine Learning:
Use Kibana’s machine-learning capabilities to set up anomaly detection for your data streams.