In the modern cloud-driven world, ensuring the health and performance of your applications and infrastructure is crucial. Google Cloud Monitoring, a service within the Google Cloud Platform (GCP), provides real-time observability of your systems, applications, and infrastructure. It enables organizations to monitor, analyze, and act on telemetry data, ensuring optimal performance and reliability. This blog explores what Google Cloud Monitoring is, its top use cases, features, architecture, installation, and beginner-friendly tutorials to help you get started.
What is Google Cloud Monitoring?
Google Cloud Monitoring is a cloud-native monitoring and observability service offered by Google Cloud. It collects, visualizes, and analyzes metrics, logs, and traces from various sources, including GCP resources, on-premises systems, and hybrid cloud environments. Google Cloud Monitoring helps teams identify performance bottlenecks, detect anomalies, and optimize resource usage in real-time.
Key highlights of Google Cloud Monitoring:
- Unified monitoring: Tracks metrics, logs, and traces from diverse environments.
- Scalability: Handles monitoring needs for small setups and enterprise-level infrastructures.
- Integration: Seamlessly integrates with GCP services and third-party tools like PagerDuty, Slack, and Grafana.
Google Cloud Monitoring empowers organizations to maintain operational excellence, proactively resolve issues, and deliver high-quality user experiences.
Top 10 Use Cases of Google Cloud Monitoring
- Application Performance Monitoring (APM)
Tracks application metrics such as response times, error rates, and request counts, enabling performance optimization. - Infrastructure Monitoring
Monitors GCP resources like Compute Engine, Kubernetes Engine, and Cloud Storage to ensure operational efficiency. - Hybrid Cloud Monitoring
Extends monitoring to hybrid and multi-cloud setups using Ops Agent and integrations. - Log Analysis
Combines with Cloud Logging to analyze log data for troubleshooting and debugging. - Alerting and Incident Response
Sets up alerts based on predefined thresholds or anomalies, ensuring quick responses to critical issues. - Cost Optimization
Monitors resource utilization to identify underused resources and optimize cloud spending. - Compliance and Security Monitoring
Tracks security logs and compliance metrics to ensure adherence to industry regulations. - Event-Driven Automation
Automates responses to system changes or anomalies using Cloud Functions or Cloud Run. - Kubernetes Monitoring
Provides deep visibility into GKE clusters, tracking pod health, resource usage, and cluster performance. - Custom Metrics Monitoring
Tracks business-specific metrics like user activity, transaction volumes, or custom KPIs.
What Are the Features of Google Cloud Monitoring?
- Real-Time Metrics Collection
Tracks metrics from GCP services, on-premises systems, and external applications. - Dashboards and Visualizations
Creates interactive dashboards to visualize key metrics and system health. - Alerts and Notification Channels
Configures alert policies and sends notifications through email, Slack, PagerDuty, or other integrations. - SLO Monitoring
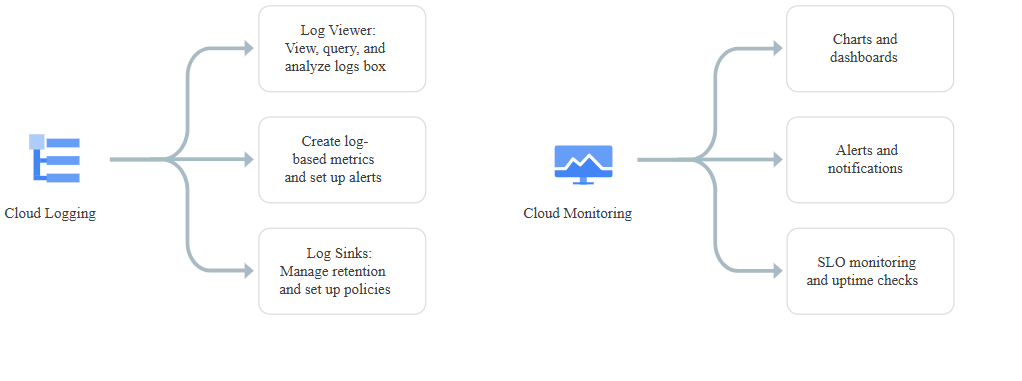
Monitors service level objectives (SLOs) and service level indicators (SLIs) to ensure adherence to SLAs. - Integration with Cloud Logging
Offers seamless log-to-metric correlation for faster troubleshooting. - Multi-Environment Support
Monitors hybrid and multi-cloud environments for unified observability. - Uptime Checks
Configures uptime checks to monitor application availability from multiple locations. - Custom Metrics
Publishes custom metrics for application-specific monitoring needs. - Anomaly Detection
Uses machine learning to identify unusual patterns or performance issues. - Scalable and Resilient Architecture
Supports monitoring at scale with high availability and low latency.
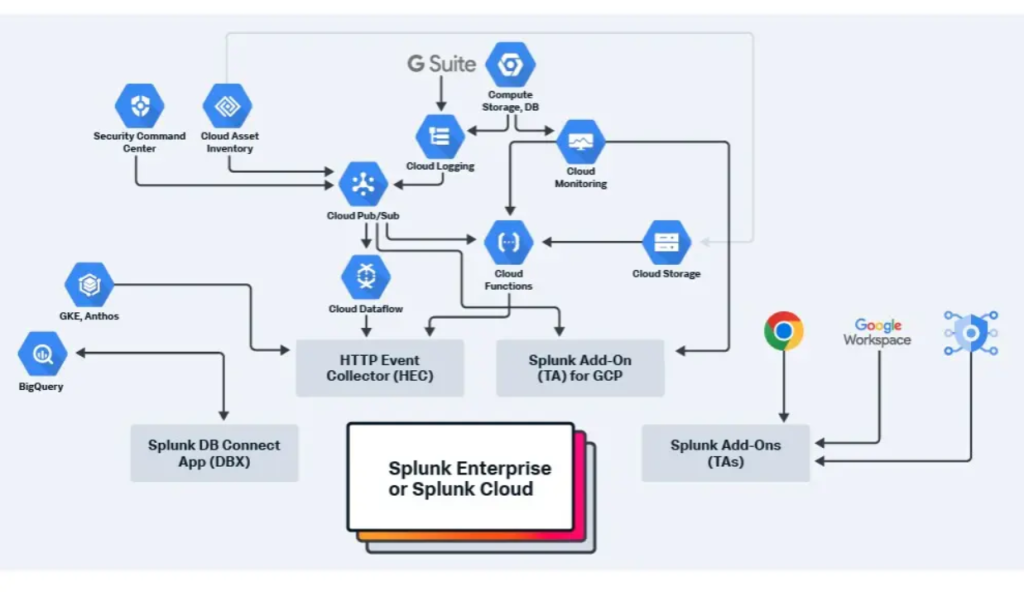
How Google Cloud Monitoring Works and Architecture
How It Works
Google Cloud Monitoring operates by collecting telemetry data (metrics, logs, and traces) from various sources. It stores this data in a centralized repository and provides tools for visualization, alerting, and automated responses. Users can interact with the data through the Google Cloud Console, APIs, or third-party tools.
Architecture Overview
- Data Sources:
- GCP Services: Compute Engine, App Engine, GKE, BigQuery, etc.
- On-Premises and Hybrid: Monitored using Ops Agent or Cloud Monitoring Agents.
- Custom Applications: Sends metrics via the Cloud Monitoring API.
- Data Ingestion and Processing:
- Metrics and logs are collected in real time and processed for analysis.
- Storage and Analysis:
- Metrics are stored in the Time Series Database, while logs are stored in Cloud Logging.
- Visualization and Insights:
- Dashboards and metrics explorers provide real-time insights.
- Logs Insights enables log analysis using a query interface.
- Alerting and Automation:
- Configures alerts to trigger notifications or automated actions like scaling resources.
How to Install Google Cloud Monitoring
1. Prerequisites
- An active Google Cloud Platform account.
- Admin access to the Google Cloud project.
2. Enable Monitoring in GCP
- Go to the Google Cloud Console > APIs & Services > Enable APIs and Services.
- Search for and enable the Cloud Monitoring API.
3. Install Ops Agent
- For hybrid or on-premises environments, install the Ops Agent:
curl -sSO https://dl.google.com/cloudagents/add-google-cloud-ops-agent-repo.sh
sudo bash add-google-cloud-ops-agent-repo.sh --also-install
4. Set Up Dashboards
- Navigate to Cloud Monitoring > Dashboards in the Google Cloud Console.
- Create a new dashboard and add widgets to monitor specific metrics.
5. Configure Alerts
- Go to Cloud Monitoring > Alerts > Create Policy.
- Define a metric, set thresholds, and link a notification channel like email or Slack.
6. Integrate with Logging
- Use Cloud Logging to collect and correlate logs with metrics for enhanced troubleshooting.
Basic Tutorials of Google Cloud Monitoring: Getting Started
1. Create a Dashboard
- Go to Cloud Monitoring in the Google Cloud Console.
- Click Dashboards > Create Dashboard.
- Add widgets to visualize key metrics like CPU usage, memory utilization, and network traffic.
2. Set Up an Uptime Check
- Navigate to Cloud Monitoring > Uptime Checks.
- Configure a check for your application’s endpoint and monitor its availability.
3. Configure Alerts
- Create an alert policy for high CPU usage:
- Go to Cloud Monitoring > Alerts > Create Policy.
- Select Compute Engine > CPU Utilization.
- Set a threshold and define a notification channel.
4. Publish Custom Metrics
- Use the Monitoring API to send custom metrics:
from google.cloud import monitoring_v3

client = monitoring_v3.MetricServiceClient()
project_name = f"projects/{project_id}"
series = monitoring_v3.TimeSeries()
series.metric.type = "custom.googleapis.com/my_metric"
series.resource.type = "global"
point = series.points.add()
point.value.double_value = 123.45
client.create_time_series(name=project_name, time_series=[series])
5. Analyze Logs with Logs Insights
- Go to Cloud Logging and open Logs Explorer.
- Run queries to analyze logs:
resource.type="gce_instance"
severity="ERROR"
6. Monitor Kubernetes Clusters
- Use Cloud Monitoring to monitor GKE clusters for pod health, resource usage, and cluster performance.